DRAG QUEENS
It’s no secret, I am a Drag Race super fan. My objective for this project was to create a comprehensive repository of information about RuPaul’s Drag Race and related franchises. I created an Entity Relationship Diagram (ERD), outlining how different entities connect to each other (e.g. a Franchise can have many Seasons, a Season has Contestants and Episodes). Then I produced R scripts to scrape and collect the outlined information. There are a total of 9 tables. To-date, the repository contains information on 12 different drag race franchises and 370+ contestants.
DATA COLLECTION

Scraping & Pre-Processing
The majority of data for this project was collected using an R web scraping library, rvest (equivalent of Python’s Beautiful Soup). Data was scraped from Wikipedia & RuPaul’s FanWiki.
Data collected was then normalized and reshaped using additional R libraries (namely tidyverse).
Data encompasses RuPaul’s Drag Race, All Stars, and all International franchises (e.g. Canda’s Drag Race). For seasons still in progress or not yet aired, there may be incongruencies in table information - e.g. season contestants are present, but episode outcomes are not.
DRAG RACE CONTESTANTS

International Drag NetWerk
I wanted to explore the relationships among contestants across different international franchises and seasons. The analysis includes contestants from region specific franchises - UK, Canada, Holland, España, Italia, and France - and includes cross-overs from RuPaul’s global “Drag vs. The World” spin-offs, e.g. Canada’s Drag Race vs. The World.
Since España, Italia, and France are relatively new compared to other international shows, it’s not surprising to see no overlap of contests with the Global franchise (yet).
The network graph was produced using R ggplot and GGally.

Drag Queens - But Make It Sports!
I’ve seen a number of beautiful data table visualizations about athletes and related sports statistics (especially NFL). I wanted to do something similar for RuPaul’s Drag Race contestants (all franchises and seasons). I used reactablefmtr to create the table using season contestant information and htmlwidgets to export the table in HTML format.
Table shows contestants, their respective rank, and placement outcome % out of all challenges.
The interactive version is available here.
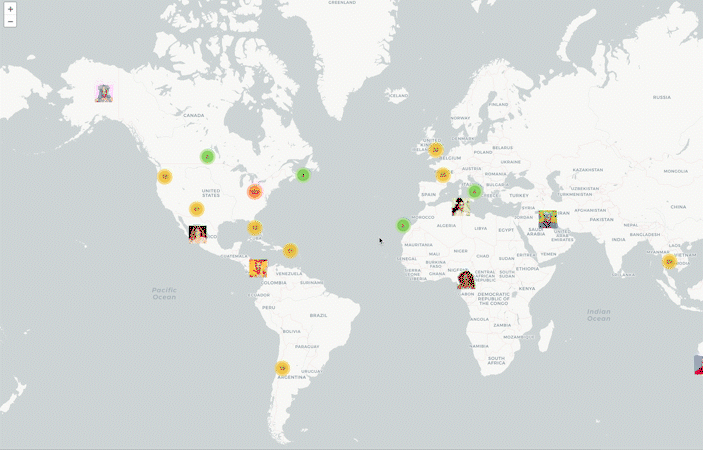
Where Are You Queen?
Where are the queens originally from? I used tidygeocoder to produce the geo coordinates for each hometown, and used leafletR (Leaflet wrapper) to generate the map. It's pretty cool to see how Ru's family footprint has expanded around the world over the past decade. You can find a queen in almost every continent!
The interactive version available here.
DRAG RACE MUSIC

Background
Each episode of Drag Race is known for ending with an epic lip sync dual. At the end of an episode, select contestants will face off in a lip sync battle. These contestants either represent the bottom or the top of the group depending on the show format. The traditional show format calls for the bottom two contestants to perform: the winner gets to continue on to the next round, while the other losing contestant “sashays away” (eliminated). In some lip syncs, there is a tie outcome - either both contestants win, or both contestants are eliminated.
Audio Features
After collecting the list of lip sync songs per season and episode, I used Spotify’s API to run a search on each song using song title and artist and return Spotify’s track ID along with a list of the song’s audio features. These audio features are assigned by Spotify and are typically scaled from 0 to 1. These features include - “danceability”, “speechiness”, “energy”, "and “valence.”
To explore these Spotify features, I created a radar plot of all lip sync songs on RuPaul’s All Stars Season 2. Winning contestant is depicted in the center of each plot. Plot rendered using R ggplot and ggplot extension packages (e.g. ggimage, ggtext, and geom_textpath).
Custom Playlist
I plugged the collection of lip sync songs into Spotify’s API service to get each song’s Spotify Track ID and related track information (e.g. audio features). Before digging into some EDA, I wanted to create my own RuPaul’s Lip Sync playlist. With the Spotify API, users are able to generate their own playlists by passing track IDs and the target playlist ID. This saved a TON of time, in a matter of seconds I had 300+ songs and 20hrs worth of lip sync songs in my very own playlist.
Songs by Decade
With a new dataset of song information, I wanted to see the distribution of lip sync songs by album decade. I had a sneaky feeling Ru favored songs from the 80’s. I added some additional details like most featured artist per decade and important milestone notes to generate what I’d call a “timeline bar graph.” No surprise, RuPaul is also one of the top artists - many songs from his Supermodel of The World and succeeding albums are used as lip sync tracks.
